Embarking on a journey to optimize your application’s performance and cost-efficiency? Configuring autoscaling for your application is the key to unlocking a realm of dynamic resource management. This guide delves into the intricacies of autoscaling, exploring how it automatically adjusts your application’s capacity to meet fluctuating demands, ensuring optimal performance, and minimizing unnecessary expenses.
From understanding the fundamental concepts of autoscaling to implementing advanced strategies, we’ll navigate the critical aspects of setting up and managing this powerful technology. We will cover the metrics that drive autoscaling decisions, the infrastructure choices available, and the step-by-step configuration processes for various platforms. Furthermore, we will explore scaling policies, monitoring techniques, and best practices for testing and troubleshooting, empowering you to build a resilient and cost-effective application infrastructure.
Introduction to Autoscaling
Autoscaling is a crucial aspect of modern cloud computing, enabling applications to automatically adjust their resource allocation based on demand. Its primary purpose is to maintain application performance and availability while optimizing costs. By dynamically scaling resources up or down, autoscaling ensures that applications can handle fluctuating workloads efficiently.Autoscaling offers significant advantages for both application performance and cost efficiency. It ensures applications remain responsive even during traffic spikes by automatically adding more resources when needed.
This proactive approach prevents performance degradation and ensures a positive user experience. Simultaneously, autoscaling optimizes costs by scaling down resources during periods of low demand. This prevents over-provisioning and reduces unnecessary expenses, making it a cost-effective solution for resource management.
Applications Benefiting from Autoscaling
Autoscaling is particularly beneficial for applications experiencing variable or unpredictable traffic patterns. These applications can leverage autoscaling to dynamically adjust their resource consumption, ensuring optimal performance and cost efficiency.
- Web Applications: Web applications frequently experience fluctuations in user traffic, especially during peak hours or promotional events. Autoscaling enables these applications to handle sudden surges in traffic without performance degradation, providing a seamless user experience. For example, an e-commerce website might experience a significant increase in traffic during a holiday sale. Autoscaling would automatically provision additional servers to handle the increased load, ensuring that users can browse products, add items to their carts, and complete purchases without experiencing delays.
- Mobile Applications: Mobile applications, particularly those with a large user base, often experience unpredictable spikes in usage. Autoscaling helps mobile applications maintain responsiveness and availability, regardless of user activity. Consider a popular mobile game that releases a new update. The sudden influx of players trying to download and play the updated game would require additional server resources. Autoscaling would automatically scale up the backend infrastructure to accommodate the increased demand.
- Batch Processing Applications: Batch processing applications, such as those used for data analysis or image processing, often have variable workloads. Autoscaling allows these applications to scale resources up during periods of high processing demand and scale down when the workload decreases. For instance, a data analysis company might run a batch job to process a large dataset. Autoscaling would automatically provision the necessary compute resources to complete the job efficiently.
- API Services: API services are commonly used by a variety of applications and services. Autoscaling enables API services to handle fluctuating request volumes, ensuring that the service remains available and responsive. For example, a weather API service might experience a spike in requests during a severe weather event. Autoscaling would automatically provision additional servers to handle the increased traffic, ensuring that the API remains available for all its users.
Understanding Scaling Metrics
Autoscaling relies on monitoring key performance indicators (KPIs) to determine when to scale your application. These metrics provide insights into the application’s resource utilization and performance, enabling the autoscaling service to dynamically adjust the number of instances to meet demand. Selecting the correct metrics and setting appropriate thresholds are crucial for ensuring optimal application performance and cost efficiency.
Identifying Key Metrics for Autoscaling
The most commonly used metrics for triggering autoscaling events are CPU utilization, memory usage, and network traffic. These metrics provide a direct measure of the application’s workload and resource consumption.
- CPU Utilization: This metric reflects the percentage of CPU resources being used by the application. High CPU utilization often indicates that the application is struggling to keep up with the workload, which could be due to increased user requests, complex computations, or inefficient code. When CPU utilization exceeds a predefined threshold, autoscaling can add more instances to distribute the load.
- Memory Usage: This metric measures the amount of memory being consumed by the application. High memory usage can lead to performance degradation, such as slow response times or even application crashes. Similar to CPU utilization, exceeding a memory usage threshold can trigger autoscaling to add more instances, providing each instance with more available memory.
- Network Traffic: This metric monitors the amount of data being transferred in and out of the application. High network traffic can indicate a large number of user requests, especially for applications that serve content or process data over the network. Autoscaling can use network traffic metrics to scale the application horizontally, ensuring sufficient network bandwidth to handle the incoming requests.
Choosing Appropriate Metrics for Different Application Types
The choice of scaling metrics should align with the specific characteristics of the application. Different application types may exhibit different resource consumption patterns, necessitating the selection of metrics that accurately reflect their workload.
- Web Applications: For web applications, CPU utilization and network traffic are often the primary metrics. High traffic volumes or complex page rendering can lead to increased CPU usage, and high network traffic directly correlates with the number of requests being served. Memory usage can also be important, especially for applications that cache data or handle large amounts of user data.
- Database Applications: Database applications may benefit from monitoring metrics like disk I/O (input/output) operations per second (IOPS), connection pool utilization, and query response times, in addition to CPU and memory usage. High IOPS or slow query response times might indicate that the database server is overloaded, triggering autoscaling.
- Batch Processing Applications: For batch processing applications, metrics like the number of jobs in the queue, the time spent processing jobs, and CPU utilization are relevant. If the job queue grows too large or jobs take too long to process, autoscaling can add more instances to expedite the processing.
- Microservices: Microservices architectures often require a more granular approach to autoscaling. Monitoring individual service metrics like request latency, error rates, and resource consumption can help pinpoint performance bottlenecks and trigger autoscaling for specific services.
Understanding Scaling Thresholds
Scaling thresholds define the boundaries that trigger autoscaling actions. These thresholds are crucial for controlling the autoscaling behavior and ensuring that the application scales appropriately in response to changes in demand. Setting these thresholds correctly is a balancing act, requiring careful consideration of the application’s performance characteristics and cost constraints.
- Defining Thresholds: Thresholds are typically defined as upper and lower bounds for the selected metrics. When a metric exceeds the upper threshold (e.g., CPU utilization above 80%), the autoscaling service will add more instances. Conversely, when a metric falls below the lower threshold (e.g., CPU utilization below 20%) for a sustained period, the service may remove instances to conserve resources and reduce costs.
- Impact of Thresholds: The choice of thresholds significantly impacts the autoscaling behavior. Aggressive thresholds (lower upper bounds and higher lower bounds) can lead to frequent scaling actions, potentially resulting in unnecessary costs or performance fluctuations. Conservative thresholds (higher upper bounds and lower lower bounds) can lead to slower scaling responses, potentially impacting application performance during peak loads.
- Examples:
- For a web application, an upper threshold for CPU utilization might be set at 75%. If the average CPU utilization across all instances consistently exceeds this value, the autoscaling service will add more instances.
- A lower threshold for memory usage might be set at 30%. If memory usage consistently falls below this value, the autoscaling service might remove some instances.
- Importance of Testing: It’s important to test and refine the scaling thresholds over time. Monitoring the application’s performance and cost after implementing autoscaling helps determine if the thresholds are set correctly. Adjustments may be needed to optimize the scaling behavior and achieve the desired balance between performance and cost efficiency.
Infrastructure Choices for Autoscaling
Autoscaling implementations are significantly shaped by the underlying infrastructure. The choice of cloud provider or the decision to manage autoscaling independently has a profound impact on the available features, complexity of setup, and operational overhead. Understanding these differences is crucial for selecting the most appropriate autoscaling strategy for an application. This section will delve into the nuances of autoscaling across different cloud providers and explore the distinctions between managed and unmanaged solutions.
Cloud Provider Autoscaling: AWS, Azure, and GCP
Cloud providers offer their own autoscaling services, each with unique strengths and weaknesses. The choice of cloud provider heavily influences the specific tools, configurations, and cost structures associated with autoscaling. These differences are primarily related to the services offered, the metrics available for scaling decisions, and the overall integration with other cloud services.
- AWS Auto Scaling: AWS Auto Scaling is a comprehensive service that allows users to automatically scale various AWS resources, including EC2 instances, ECS tasks, and DynamoDB tables. It supports a wide range of scaling metrics, including CPU utilization, memory utilization, and custom metrics from CloudWatch. AWS Auto Scaling provides features such as predictive scaling, which proactively scales resources based on predicted traffic patterns.
For example, a media streaming service might use predictive scaling to anticipate a surge in viewership during peak hours, ensuring sufficient resources are available.
- Azure Autoscale: Azure Autoscale is a service within Azure that enables automatic scaling of resources like virtual machines, virtual machine scale sets, and App Service plans. It uses metrics from Azure Monitor to trigger scaling actions. Azure Autoscale supports both reactive scaling based on real-time metrics and scheduled scaling based on pre-defined schedules. A typical use case involves scaling up a web application during business hours and scaling down during off-peak hours to optimize costs.
- Google Cloud Autoscaling: Google Cloud offers Autoscaling as part of its Compute Engine and other services. It allows for automatic scaling of virtual machines, container clusters (e.g., Kubernetes Engine), and other Google Cloud resources. Google Cloud Autoscaling relies on metrics provided by Cloud Monitoring. It provides features like load-based autoscaling and can also scale based on custom metrics. A gaming company might use Google Cloud Autoscaling to dynamically adjust the number of game servers based on the number of active players.
Managed vs. Unmanaged Autoscaling Services
The decision between managed and unmanaged autoscaling services involves trade-offs between ease of use, flexibility, and control. Managed services provide a simplified experience with pre-configured features and integrations, while unmanaged services offer greater customization and control over the autoscaling process.
- Managed Autoscaling: Managed autoscaling services are provided by cloud providers and offer a streamlined approach to scaling. These services typically provide a user-friendly interface for defining scaling policies, monitoring metrics, and automating scaling actions. The cloud provider handles the underlying infrastructure and management tasks, such as provisioning and de-provisioning resources. This reduces operational overhead and simplifies the scaling process.
- Unmanaged Autoscaling: Unmanaged autoscaling involves implementing autoscaling solutions manually or using third-party tools. This approach provides greater flexibility and control over the autoscaling process. It allows for customization of scaling algorithms, integration with custom monitoring systems, and fine-grained control over resource provisioning and de-provisioning. However, it also requires more technical expertise and operational effort.
Comparison of Autoscaling Platforms
The following table compares the features and limitations of different autoscaling platforms, including AWS Auto Scaling, Azure Autoscale, Google Cloud Autoscaling, and a hypothetical unmanaged autoscaling solution using a tool like Kubernetes Horizontal Pod Autoscaler (HPA).
| Feature | AWS Auto Scaling | Azure Autoscale | Google Cloud Autoscaling | Unmanaged Autoscaling (e.g., Kubernetes HPA) |
|---|---|---|---|---|
| Ease of Use | User-friendly interface, integrates with other AWS services. | Easy to set up and configure, integrates with other Azure services. | Simple configuration, integrates well with other Google Cloud services. | Requires more setup and configuration; steep learning curve for Kubernetes. |
| Supported Resources | EC2 instances, ECS tasks, DynamoDB tables, and more. | Virtual machines, virtual machine scale sets, App Service plans, and more. | Compute Engine instances, Kubernetes Engine, and other Google Cloud resources. | Containers (e.g., Kubernetes pods), potentially other resources through custom implementations. |
| Scaling Metrics | CPU utilization, memory utilization, custom CloudWatch metrics, and more. | CPU utilization, memory utilization, custom Azure Monitor metrics, and more. | CPU utilization, memory utilization, custom Cloud Monitoring metrics, and more. | CPU utilization, memory utilization, custom metrics, and more (depending on the implementation). |
| Customization | Offers predictive scaling and more advanced configurations. | Supports scheduled scaling and complex rule sets. | Provides load-based autoscaling and supports custom metrics. | Highly customizable; allows for fine-grained control over scaling behavior. |
| Cost | Pay-as-you-go based on resource usage. | Pay-as-you-go based on resource usage. | Pay-as-you-go based on resource usage. | Cost depends on the underlying infrastructure and any third-party tools used. |
| Limitations | Tightly coupled with the AWS ecosystem. | Tightly coupled with the Azure ecosystem. | Tightly coupled with the Google Cloud ecosystem. | Requires significant technical expertise and ongoing maintenance. |
Autoscaling Configuration
Configuring autoscaling is a crucial step in ensuring your application can handle fluctuating workloads efficiently. This section provides a step-by-step guide, focusing on AWS EC2 Auto Scaling, to demonstrate how to set up and manage autoscaling policies. The process involves defining launch configurations, scaling policies, and notification mechanisms to optimize resource allocation based on demand.
Setting Up EC2 Auto Scaling: Step-by-Step Guide
To successfully configure autoscaling on AWS EC2, follow these detailed steps. Each step is critical for ensuring your application scales effectively and remains highly available.
- Create a Launch Template or Configuration: Before setting up Auto Scaling, define the configuration for your EC2 instances. This involves specifying the Amazon Machine Image (AMI), instance type, security groups, and other necessary configurations. Using a launch template is recommended as it offers versioning and more flexibility. This configuration acts as a blueprint for new instances.
- Create an Auto Scaling Group (ASG): An Auto Scaling Group manages the lifecycle of your instances. In the AWS Management Console, navigate to the EC2 service and select “Auto Scaling Groups.” Here, you’ll specify the launch template or configuration, the desired capacity (initial number of instances), minimum capacity, and maximum capacity. You’ll also define the subnets where your instances will be launched.
- Define Scaling Policies: Scaling policies determine when and how your Auto Scaling Group adjusts the number of instances. These policies are triggered based on metrics like CPU utilization, network traffic, or custom metrics.
- Set Up Scaling Policies Based on CPU Utilization: CPU utilization is a common metric for scaling. Configure a scaling policy that increases the number of instances when CPU utilization exceeds a threshold (e.g., 70%) and decreases the number of instances when utilization falls below a lower threshold (e.g., 40%).
- Configure Scaling Policies Based on Network Traffic: Network traffic can also trigger scaling. Create policies that scale based on the average number of bytes received or sent per instance. For instance, increase the number of instances if the average network in/out traffic exceeds a certain threshold over a sustained period.
- Set Up Scaling Policies Based on Custom Metrics: You can use custom metrics from Amazon CloudWatch to trigger scaling actions. This allows you to scale based on application-specific metrics, such as the number of active users, queue depth, or database connections. This provides greater control and customization.
- Configure Health Checks: Health checks ensure that instances within the Auto Scaling Group are functioning correctly. AWS provides default health checks, but you can also configure custom health checks. If an instance fails a health check, it will be automatically terminated and replaced.
- Configure Notifications: Set up notifications to be alerted about scaling events. You can use Amazon SNS to receive notifications via email, SMS, or other channels whenever an instance is launched, terminated, or when scaling activities occur. This helps you monitor the performance of your autoscaling setup.
- Test Your Configuration: After setting up your Auto Scaling Group and scaling policies, it’s important to test them. Simulate increased load on your application to verify that the instances scale up as expected. Similarly, simulate a decrease in load to ensure the instances scale down correctly.
- Monitor and Optimize: Continuously monitor the performance of your Auto Scaling Group using CloudWatch metrics. Analyze the scaling behavior and adjust your scaling policies as needed. You might need to fine-tune thresholds or add more advanced scaling configurations to optimize resource utilization and application performance.
Scaling Policies and Strategies
Scaling policies dictate how your autoscaling system reacts to changes in demand. Choosing the right policy is crucial for ensuring your application’s performance and cost-effectiveness. The best approach often involves a combination of policies tailored to your specific needs and traffic patterns.
Dynamic Scaling
Dynamic scaling, also known as reactive scaling, adjusts resources in real-time based on observed metrics. This approach is ideal for handling unpredictable traffic fluctuations and ensuring optimal resource utilization.
- How it Works: Dynamic scaling continuously monitors key metrics like CPU utilization, memory usage, or request latency. When these metrics exceed predefined thresholds, the autoscaling system automatically adds or removes instances.
- Pros:
- Reacts quickly to changing conditions, ensuring application responsiveness.
- Optimizes resource allocation, potentially reducing costs by scaling down during periods of low demand.
- Cons:
- Can be reactive, meaning it responds to issues after they arise. This can lead to brief periods of degraded performance if scaling takes time.
- Requires careful configuration of thresholds to avoid oscillations (rapid scaling up and down) and to ensure the system isn’t overreacting to temporary spikes.
- Use Cases: Ideal for applications with unpredictable workloads, such as web applications, APIs, and e-commerce platforms.
Scheduled Scaling
Scheduled scaling allows you to predefine scaling actions based on a schedule. This is particularly useful for handling predictable traffic patterns, such as daily, weekly, or seasonal events.
- How it Works: You configure the autoscaling system to scale resources up or down at specific times or intervals. For example, you might schedule an increase in the number of instances before peak hours and a decrease during off-peak hours.
- Pros:
- Proactive approach that anticipates traffic changes, ensuring resources are available when needed.
- Provides control over resource allocation based on known patterns.
- Can be used to optimize costs by scaling down resources during periods of low demand.
- Cons:
- Relies on accurate predictions of traffic patterns. If the actual traffic deviates significantly from the schedule, performance may be impacted or resources may be wasted.
- Requires careful planning and configuration of schedules.
- Use Cases: Suitable for applications with predictable traffic, such as news websites, retail sites with scheduled promotions, and applications with batch processing jobs.
Predictive Scaling
Predictive scaling leverages machine learning models to forecast future traffic and proactively scale resources. This approach aims to anticipate demand changes and scale resources before they are needed, minimizing performance impacts.
- How it Works: Predictive scaling analyzes historical data and uses machine learning algorithms to predict future traffic patterns. Based on these predictions, the autoscaling system adjusts resources accordingly.
- Pros:
- Proactive scaling that can minimize latency and performance degradation.
- Can handle complex traffic patterns that are difficult to predict with other methods.
- Cons:
- Requires significant historical data for accurate predictions.
- Can be more complex to implement and manage.
- Prediction accuracy can be affected by unforeseen events or changes in user behavior.
- Use Cases: Useful for applications with complex or evolving traffic patterns, such as streaming services, social media platforms, and financial applications.
Example: Scheduled Scaling for Predictable Traffic Spikes
Consider an e-commerce website that runs a weekly promotional campaign every Saturday from 10:00 AM to 4:00 PM. The website typically experiences a significant increase in traffic during this period.To handle this predictable traffic spike, a scheduled scaling policy can be implemented.
- Schedule Configuration: The autoscaling system is configured to scale up the number of instances from 5 to 15 at 9:00 AM every Saturday. This provides a buffer before the traffic spike.
- Scale-Down Configuration: At 5:00 PM every Saturday, the system scales down the number of instances from 15 back to 5. This ensures that resources are not over-provisioned during off-peak hours.
- Dynamic Scaling Integration (Optional): While scheduled scaling handles the predictable spike, dynamic scaling can be configured alongside the scheduled scaling to handle any unexpected traffic variations during the promotional period. For instance, if CPU utilization exceeds 80% at any point during the promotion, the dynamic scaling policy could automatically add more instances.
This approach ensures that the website has sufficient resources to handle the increased traffic during the promotion, maintaining a good user experience, while also optimizing costs by scaling down resources outside of the promotion hours.
Monitoring and Alerting
Effectively monitoring autoscaling activity and application performance is crucial for ensuring optimal resource utilization, maintaining application stability, and proactively addressing potential issues. Implementing robust monitoring and alerting systems allows administrators to gain insights into the scaling process, identify performance bottlenecks, and receive timely notifications of critical events. This proactive approach enables informed decision-making and prevents service disruptions.
Monitoring Autoscaling Activity and Application Performance
Comprehensive monitoring provides the necessary visibility into the autoscaling process and application behavior. This involves tracking key metrics to understand how the system is responding to changes in demand and identifying any areas needing attention.
- Autoscaling Metrics: Monitor the metrics that trigger scaling actions. This includes CPU utilization, memory usage, network traffic, and custom metrics specific to the application. Analyzing these metrics helps to understand the effectiveness of scaling policies and identify potential adjustments. For instance, if CPU utilization consistently reaches a high threshold, it may indicate that the scaling policy is not aggressive enough, or that the application needs optimization.
- Instance Status: Track the status of individual instances, including their health, launch times, and termination events. This provides insights into the availability and lifecycle of application instances. Monitoring instance status helps in identifying instances that are failing health checks, which might require investigation and potential replacement.
- Application Performance Metrics: Monitor key application performance indicators (KPIs) such as response times, error rates, and transaction throughput. These metrics reflect the user experience and the application’s ability to handle requests. A sudden increase in response times or error rates could indicate that the application is struggling under the current load, even if autoscaling is triggered.
- Logs: Collect and analyze logs from both the autoscaling service and the application itself. Logs provide detailed information about events, errors, and warnings that can help diagnose issues. Analyzing logs is crucial for troubleshooting scaling problems, identifying application errors, and understanding the root causes of performance degradation.
- Tools and Platforms: Leverage monitoring tools and platforms offered by cloud providers (e.g., AWS CloudWatch, Azure Monitor, Google Cloud Monitoring) or third-party solutions (e.g., Datadog, New Relic, Prometheus). These tools offer features for collecting, aggregating, visualizing, and alerting on metrics and logs. They provide dashboards and customizable alerts.
Setting Up Alerts
Configuring alerts is essential for proactively notifying administrators of scaling events or potential issues. Alerts trigger notifications based on predefined thresholds or patterns in the monitored metrics, enabling timely intervention and preventing service disruptions.
- Alerting Thresholds: Define clear thresholds for key metrics. For example, set an alert to trigger when CPU utilization exceeds 80% for a sustained period. This helps to identify potential performance bottlenecks before they impact users.
- Alerting Rules: Configure rules that specify the conditions under which alerts should be triggered. Rules can be based on single metric thresholds, multiple metric combinations, or patterns in metric data.
- Notification Channels: Configure notification channels to deliver alerts to the appropriate stakeholders. This includes email, SMS, messaging platforms (e.g., Slack, Microsoft Teams), and incident management systems.
- Alert Severity Levels: Assign severity levels to alerts (e.g., critical, warning, info) to prioritize and manage them effectively. Critical alerts require immediate attention, while warning alerts may indicate potential issues that need investigation.
- Alerting Examples:
- High CPU Utilization: Alert when CPU utilization exceeds 80% for 5 minutes.
- Application Error Rate Increase: Alert when the application error rate exceeds 1% for 10 minutes.
- Scaling Failure: Alert when autoscaling fails to launch new instances.
- Instance Health Check Failure: Alert when an instance fails health checks.
Visualizing Autoscaling Metrics
Visualizing autoscaling metrics is critical for tracking trends, understanding the behavior of the autoscaling system, and identifying areas for optimization. Dashboards and graphs provide a clear and concise overview of key metrics, enabling data-driven decision-making.
- Dashboards: Create dashboards that display key autoscaling and application performance metrics. Dashboards should be customizable to show the most relevant information.
- Graphs: Use graphs to visualize metrics over time. This helps to identify trends, patterns, and anomalies.
- Common Visualizations:
- CPU Utilization Over Time: A line graph showing CPU utilization of instances.
- Number of Instances Over Time: A line graph showing the number of active instances.
- Response Time Over Time: A line graph showing the application’s response time.
- Scaling Activity Timeline: A graph that shows scaling events (launching and terminating instances) over time, along with associated metrics.
- Trend Analysis: Analyze trends in the visualized metrics to identify areas for improvement. For example, if CPU utilization is consistently high during peak hours, the scaling policy might need to be adjusted to scale out faster.
- Tools for Visualization: Use the built-in dashboarding features of cloud providers or third-party monitoring tools. These tools typically offer drag-and-drop interfaces for creating custom dashboards and graphs.
Testing Autoscaling Configurations
Ensuring your autoscaling configuration functions correctly is crucial to maintaining application performance and cost efficiency. Rigorous testing allows you to validate that scaling events trigger as expected under different load conditions, preventing potential outages or unnecessary resource consumption. This section Artikels effective methods for testing your autoscaling setup, emphasizing the importance of pre-production testing.
Simulating Load for Testing
Simulating realistic load is essential for verifying the responsiveness of your autoscaling configuration. Various tools and techniques can be employed to generate traffic that mimics real-world usage patterns.
- Load Testing Tools: Utilize load testing tools such as Apache JMeter, Gatling, or Locust. These tools allow you to simulate multiple users accessing your application simultaneously, generating a controlled load. They provide detailed metrics on response times, error rates, and throughput, helping you understand how your application behaves under stress. For instance, you could configure JMeter to simulate 100 concurrent users gradually increasing to 1000 over a period of time, observing the autoscaling behavior.
- Traffic Generators: Employ traffic generators, such as `hey` or `wrk`, to send a high volume of requests to your application endpoints. These tools are suitable for quickly testing the capacity of your application to handle a large number of requests. Configure these tools to generate a steady stream of requests, observing how the autoscaling responds to the incoming traffic.
- Real-World Traffic Simulation: Consider simulating real-world traffic patterns by analyzing historical traffic data. This approach involves using historical data to create a traffic profile that closely matches your application’s typical usage. Tools like `tc` (Traffic Control) can be used to shape network traffic, allowing you to simulate different load scenarios, including spikes and dips.
- Scripting for Automated Load: Develop scripts to automate load generation. This approach involves writing scripts, often in languages like Python or Bash, to generate requests to your application endpoints. These scripts can be integrated into a CI/CD pipeline to perform automated load testing as part of your deployment process.
Testing in a Staging Environment
Testing autoscaling in a staging environment is a critical step before deploying to production. This environment mirrors your production setup, allowing you to identify and resolve issues without impacting your users.
- Environment Replication: Ensure your staging environment closely resembles your production environment. This includes replicating the same infrastructure, application versions, and network configurations. The more closely the staging environment mirrors production, the more accurate your test results will be.
- Controlled Testing Scenarios: Design specific test scenarios to evaluate different aspects of your autoscaling configuration. These scenarios should cover various load conditions, including normal traffic, sudden spikes, and sustained high loads. For example, you could simulate a sudden traffic spike by increasing the number of concurrent users accessing your application.
- Monitoring and Verification: Continuously monitor the performance of your application and the behavior of your autoscaling configuration during testing. Collect metrics such as CPU utilization, memory usage, and response times. Verify that scaling events trigger as expected based on the defined metrics and thresholds. Use your monitoring dashboards to visualize the impact of load on the application.
- Iteration and Refinement: Analyze the test results and identify any issues or areas for improvement. Adjust your autoscaling configuration, thresholds, or scaling policies based on the findings. Repeat the testing process to validate the changes and ensure that your autoscaling configuration is optimized for your application’s needs.
- Example: Consider a web application deployed on AWS. You can use AWS CloudWatch to monitor the CPU utilization of your application instances. Set up an autoscaling policy that triggers when CPU utilization exceeds 70%. In your staging environment, use a load testing tool like JMeter to generate traffic that simulates a spike in user requests. Monitor the CPU utilization in CloudWatch and verify that the autoscaling policy triggers, launching additional instances to handle the increased load.
Autoscaling and Application Architecture
Autoscaling profoundly impacts how applications are designed, built, and deployed. A well-architected application considers autoscaling from the outset, allowing it to seamlessly adapt to fluctuating demand. Ignoring these considerations can lead to performance bottlenecks, increased costs, and application instability. This section explores the architectural implications of autoscaling and provides practical guidance on building autoscaling-friendly applications.
Designing Autoscaling-Friendly Applications
Designing applications for autoscaling requires a shift in perspective. Applications must be stateless or, at the very least, designed to handle state management in a distributed manner. This section Artikels key design principles to ensure your application can scale effectively.* Statelessness: The ideal application is stateless, meaning each instance of the application does not retain any client-specific data.
This allows new instances to be launched or terminated without affecting user sessions. For example, web servers handling user requests should not store session data locally. Instead, session information should be stored in a shared, scalable data store like Redis or Memcached.
Decoupling Components
Break down the application into independent, loosely coupled components. This modularity allows you to scale specific parts of the application based on their individual needs. For instance, if the image processing component is experiencing high load, you can scale it independently without affecting other parts of the application.
Horizontal Scalability
Design the application to scale horizontally, adding more instances of the same component to handle increased load. This contrasts with vertical scaling, which involves increasing the resources of a single instance. Horizontal scaling is typically preferred for autoscaling as it allows for greater flexibility and resilience.
Idempotency
Ensure that operations are idempotent, meaning that they can be executed multiple times without changing the result beyond the initial execution. This is crucial in an autoscaling environment, as instances may fail or be terminated, and operations might need to be retried. For example, database updates should be designed to handle potential duplicate executions without causing data corruption.
Caching
Implement caching mechanisms to reduce the load on backend services and improve response times. Caching can be implemented at various levels, including client-side, server-side, and database-side. Use caching strategies such as Least Recently Used (LRU) or First In, First Out (FIFO) to manage cache entries effectively.
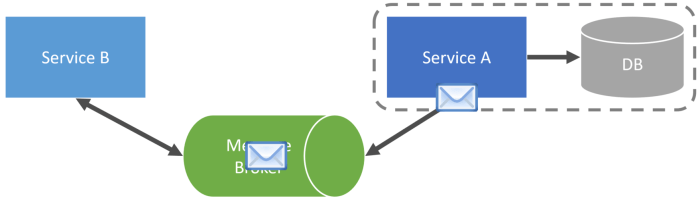
Asynchronous Processing
Utilize message queues or event-driven architectures to handle tasks asynchronously. This allows the application to offload time-consuming operations to background workers, improving responsiveness and scalability. For instance, a video encoding application can submit encoding jobs to a queue, and worker instances can process them independently.
Application State Management in Autoscaling Environments
Managing application state is a critical aspect of designing autoscaling-friendly applications. The way state is handled directly impacts the ability of an application to scale seamlessly and maintain data consistency. This section details best practices for state management in an autoscaling environment.* Shared State Stores: Utilize shared, scalable data stores for storing application state. This ensures that all instances of the application have access to the same data, regardless of which instance handles a particular request.
Examples include databases (e.g., PostgreSQL, MySQL), key-value stores (e.g., Redis, Memcached), and object storage (e.g., Amazon S3, Google Cloud Storage).
Session Management
For web applications, manage user sessions in a centralized, scalable store. This prevents session data from being tied to specific instances. Common approaches include using a shared cache like Redis or Memcached, or a database for session persistence.
Database Considerations
Choose a database that can scale horizontally and handle the expected load. Consider using a database that supports features like replication, sharding, and connection pooling. Design database schemas to optimize for read and write performance.
Stateless APIs
Design APIs to be stateless, meaning that each request contains all the information needed to process it. This eliminates the need for the server to store any client-specific state between requests.
Eventual Consistency
Be prepared to handle eventual consistency, where data may not be immediately consistent across all instances. Implement mechanisms to reconcile inconsistencies, such as retries, optimistic locking, or conflict resolution strategies.
Data Synchronization
Implement data synchronization mechanisms to ensure that data is consistent across all instances. This might involve using distributed locks, leader election, or other synchronization primitives.* Example: Consider an e-commerce application. User session data (e.g., shopping cart contents, user preferences) should be stored in a shared cache (e.g., Redis). Product information and order details should be stored in a scalable database (e.g., PostgreSQL).
Image files and other static assets should be stored in object storage (e.g., Amazon S3). By following these practices, the application can scale horizontally, handle fluctuating traffic, and maintain data consistency.
Cost Optimization with Autoscaling

Autoscaling, while primarily focused on ensuring application availability and performance, offers significant opportunities for cost optimization. By dynamically adjusting resources based on demand, autoscaling prevents over-provisioning and ensures resources are only utilized when needed, leading to direct cost savings. This section explores how to leverage autoscaling to minimize infrastructure expenses.
Methods for Setting Up Cost-Effective Scaling Policies
Setting up cost-effective scaling policies requires a strategic approach to resource allocation. This involves careful consideration of scaling triggers, instance types, and scaling behavior.
- Choosing the Right Scaling Metrics: Selecting appropriate metrics is crucial. Metrics such as CPU utilization, memory usage, and network traffic can be used to trigger scaling actions. For example, if CPU utilization consistently exceeds 70%, an autoscaling group can add more instances. The choice of metric should directly reflect the application’s performance bottlenecks.
- Selecting Cost-Optimized Instance Types: Employing a mix of instance types, including spot instances and reserved instances, can lead to substantial cost savings. Spot instances offer significant discounts but can be terminated with short notice. Reserved instances provide discounts in exchange for a commitment to use instances for a specific period. Understanding the application’s tolerance for interruptions and predicting resource needs are essential when choosing these instance types.
- Defining Scaling Cooldown Periods: Cooldown periods prevent rapid scaling actions in response to transient fluctuations in demand. This can avoid unnecessary instance launches and terminations, thereby reducing costs. The cooldown period duration should be tuned to the application’s behavior and the expected frequency of demand changes.
- Implementing Predictive Scaling: Some cloud providers offer predictive scaling features. These features use machine learning to forecast future demand based on historical data and schedule scaling actions accordingly. This proactive approach can help optimize resource allocation and minimize costs by ensuring resources are available when needed.
- Setting Minimum and Maximum Instance Limits: Defining minimum and maximum instance limits prevents over-provisioning and under-provisioning. The minimum ensures that a baseline level of resources is always available, while the maximum prevents excessive spending during peak demand.
- Utilizing Scaling Policies Based on Time Schedules: For applications with predictable traffic patterns, time-based scaling policies can be used. For example, an application might scale up during business hours and scale down during off-peak hours.
Cost-Benefit Analysis of Implementing Autoscaling
A cost-benefit analysis is essential for evaluating the financial impact of autoscaling. This involves comparing the costs of implementing and maintaining autoscaling with the benefits it provides, such as reduced infrastructure costs, improved application performance, and reduced operational overhead.
Let’s consider a hypothetical e-commerce application experiencing seasonal traffic fluctuations. The application currently uses a fixed number of instances, provisioned to handle peak traffic. This results in significant over-provisioning and wasted resources during off-peak periods.
Cost Analysis (Without Autoscaling):
- Monthly cost of fixed instances: $10,000
- Average CPU utilization during off-peak hours: 20%
- Percentage of wasted resources: 80%
Cost Analysis (With Autoscaling):
- Estimated monthly cost of autoscaling (variable based on demand): $6,000
- Average CPU utilization: Optimized, reflecting actual demand
- Cost savings: $4,000 per month
Benefits Analysis:
- Reduced Infrastructure Costs: The primary benefit is a direct reduction in infrastructure expenses due to optimized resource utilization.
- Improved Application Performance: Autoscaling ensures that sufficient resources are available to handle peak loads, improving application performance and user experience.
- Reduced Operational Overhead: Automating resource scaling reduces the need for manual intervention, freeing up IT staff to focus on other tasks.
- Increased Scalability and Flexibility: Autoscaling provides the ability to quickly respond to changing demand, ensuring the application can handle unexpected traffic spikes.
Cost-Benefit Calculation:
The implementation of autoscaling results in a monthly cost saving of $4,000. Over a year, this translates to $48,000 in savings. Additionally, the improved application performance and reduced operational overhead provide further benefits that are difficult to quantify directly but contribute to the overall value of the autoscaling implementation.
Formula for Cost Savings:
Cost Savings = (Cost Without Autoscaling)
(Cost With Autoscaling)
Conclusion:
Autoscaling provides a clear return on investment by reducing infrastructure costs and improving application performance. The specific cost savings and benefits will vary depending on the application and its traffic patterns. However, a well-designed autoscaling strategy can significantly contribute to optimizing application costs and maximizing the value of cloud infrastructure.
Troubleshooting Common Autoscaling Issues
Autoscaling, while designed to be a self-managing process, can sometimes present challenges. Identifying and resolving these issues is crucial for maintaining application performance, cost efficiency, and overall reliability. This section provides a comprehensive guide to address common autoscaling problems, offering practical solutions and a troubleshooting framework to ensure your autoscaling configurations function as intended.
Scaling Delays and Insufficient Capacity
Scaling delays can significantly impact application performance, especially during traffic spikes. Insufficient capacity, where the scaling process doesn’t add enough resources quickly enough, can lead to performance degradation and user dissatisfaction.The following points describe common causes and solutions for scaling delays and insufficient capacity:
- Slow Instance Boot Times: Virtual machine boot times can be a bottleneck. If instances take too long to become ready, the autoscaling group may not be able to respond quickly enough to increased load.
- Solution: Use pre-warmed AMIs or container images. Implement a robust startup script optimization. Consider using instance types with faster boot times.
- Delayed Metric Response: If the metrics used for scaling are slow to reflect changes in load, the autoscaling system will react with a delay.
- Solution: Monitor the metric collection frequency. Fine-tune the scaling policies and thresholds. Consider using more responsive metrics.
- Resource Limits: Resource limits, such as quotas on the number of instances or network bandwidth, can prevent the autoscaling group from scaling up.
- Solution: Review and adjust resource limits. Ensure sufficient capacity is available within your infrastructure.
- Scaling Cool-down Period: Cool-down periods, which are intentionally designed to prevent rapid scaling up or down, can cause delays if set too long.
- Solution: Carefully consider and configure the cool-down period duration. Ensure it’s long enough to prevent flapping but short enough to respond quickly to changes in demand.
Incorrect Scaling Behavior (Over-Scaling or Under-Scaling)
Incorrect scaling behavior, either over-scaling (adding too many resources) or under-scaling (not adding enough resources), can lead to significant problems. Over-scaling wastes resources and increases costs, while under-scaling leads to poor performance and user experience.The following points address common causes and solutions for incorrect scaling behavior:
- Incorrect Metric Selection: Using the wrong metrics or the wrong combination of metrics can trigger incorrect scaling actions.
- Solution: Carefully select metrics that accurately reflect application load. Consider CPU utilization, memory utilization, request latency, and custom metrics specific to your application. Regularly review and adjust metric selection based on application behavior.
- Improperly Configured Scaling Policies: Incorrect scaling policies, such as inappropriate thresholds or scaling adjustments, can cause over- or under-scaling.
- Solution: Thoroughly test and validate scaling policies in a non-production environment. Use a gradual approach when adjusting scaling policies in production. Monitor the impact of policy changes closely.
- Flapping: Flapping occurs when the autoscaling group rapidly scales up and down repeatedly, often due to unstable metrics or overly sensitive scaling policies.
- Solution: Implement a cool-down period. Adjust scaling thresholds to be less sensitive. Consider using more stable metrics or aggregating metrics over a longer time window.
- Dependency on External Services: If the application depends on external services that are experiencing performance issues, the autoscaling group may misinterpret these issues as application load and scale incorrectly.
- Solution: Monitor the health and performance of external services. Implement circuit breakers to prevent cascading failures. Consider using a combination of metrics to assess application load, including metrics related to external service performance.
Configuration Errors
Configuration errors can prevent autoscaling from functioning correctly, ranging from simple typos to complex logical flaws.Here are common configuration errors and their solutions:
- Incorrect Instance Type: Choosing the wrong instance type can lead to performance bottlenecks or wasted resources.
- Solution: Select instance types that are appropriate for your application’s workload. Consider CPU, memory, network bandwidth, and storage requirements. Test different instance types to find the optimal configuration.
- Incorrect Security Group Configuration: Improperly configured security groups can prevent instances from communicating with each other or with external services.
- Solution: Review and verify security group rules. Ensure that instances can communicate with the necessary ports and protocols. Test security group rules thoroughly.
- Incorrect Launch Configuration/Template: Errors in the launch configuration or template can prevent instances from launching or configuring correctly.
- Solution: Carefully review the launch configuration or template for errors. Test the launch configuration or template in a non-production environment. Verify that all necessary settings are configured correctly, such as AMI, instance type, security groups, and user data.
- IAM Permissions Issues: Insufficient IAM permissions can prevent instances from accessing necessary resources or performing required actions.
- Solution: Verify the IAM role assigned to the instances. Ensure that the IAM role has the necessary permissions to access resources such as S3 buckets, databases, and other services.
Frequently Asked Questions (FAQ)
This section provides answers to frequently asked questions to help troubleshoot autoscaling issues.
- Why isn’t my autoscaling group scaling up?
- Check the scaling metrics and policies. Ensure that the metrics are correctly configured and that the thresholds are appropriate. Verify that the application is actually experiencing increased load. Review the resource limits and ensure that there is sufficient capacity available. Examine the logs for any errors related to the autoscaling group.
- Review the scaling metrics and policies. Ensure that the metrics are correctly configured and that the thresholds are appropriate. Check the cool-down period to ensure it’s not too short. Investigate the logs for any errors related to the autoscaling group. Consider using a more conservative scaling strategy.
- Implement a cool-down period. Adjust scaling thresholds to be less sensitive. Consider using more stable metrics or aggregating metrics over a longer time window. Review and refine your scaling policies.
- Use cloud provider’s monitoring services. Monitor key metrics such as CPU utilization, memory utilization, network traffic, and request latency. Set up alerts to notify you of any issues. Review the logs for any errors or warnings.
- Use a non-production environment. Simulate load using load testing tools. Monitor the performance of the application during the test. Review the scaling behavior and ensure that it meets your requirements. Gradually increase the load to identify any bottlenecks or issues.
- Check the launch configuration or template for errors. Verify the AMI, instance type, security groups, and user data. Examine the logs for any errors related to the instance launch. Review the IAM permissions.
- Right-size your instances. Use spot instances or preemptible instances. Implement a scaling strategy that minimizes resource usage during periods of low load. Monitor resource utilization and identify any wasted resources. Regularly review your autoscaling configuration to ensure it’s cost-effective.
Last Point
In conclusion, mastering the art of configuring autoscaling is pivotal for any application aiming for peak performance, cost efficiency, and scalability. By understanding the core principles, carefully selecting the right metrics, and implementing appropriate scaling policies, you can create a system that seamlessly adapts to changing demands. This guide has provided a comprehensive roadmap, equipping you with the knowledge and tools to navigate the complexities of autoscaling, ultimately ensuring your application thrives in a dynamic environment.
Popular Questions
What is the difference between horizontal and vertical scaling?
Horizontal scaling involves adding more instances of your application, while vertical scaling involves increasing the resources (CPU, memory) of a single instance. Autoscaling primarily focuses on horizontal scaling.
How does autoscaling handle database scaling?
Autoscaling typically focuses on scaling the application tier. Database scaling requires different strategies, such as read replicas, sharding, or database-specific autoscaling features, which should be addressed separately.
What happens to user sessions during autoscaling events?
To maintain user sessions during scaling events, consider using session management strategies like sticky sessions, session replication, or distributed caching. This ensures that users are not abruptly logged out when new instances are added or removed.
How can I prevent autoscaling from becoming too aggressive and incurring high costs?
Carefully configure your scaling policies and thresholds based on your application’s traffic patterns and performance characteristics. Implement cost alerts and monitoring to track resource usage and proactively identify potential issues.